Real Estate Market Report First Quarter April 2014
Is the real estate market continuing to Improve?
Here are 7 info graphics and their importance on current real estate trends not just for the South Florida Luxury Real Estate Market but real estate markets in general which is provided by Emh3.com Luxury Real Estate Brokers and CoreLogic.
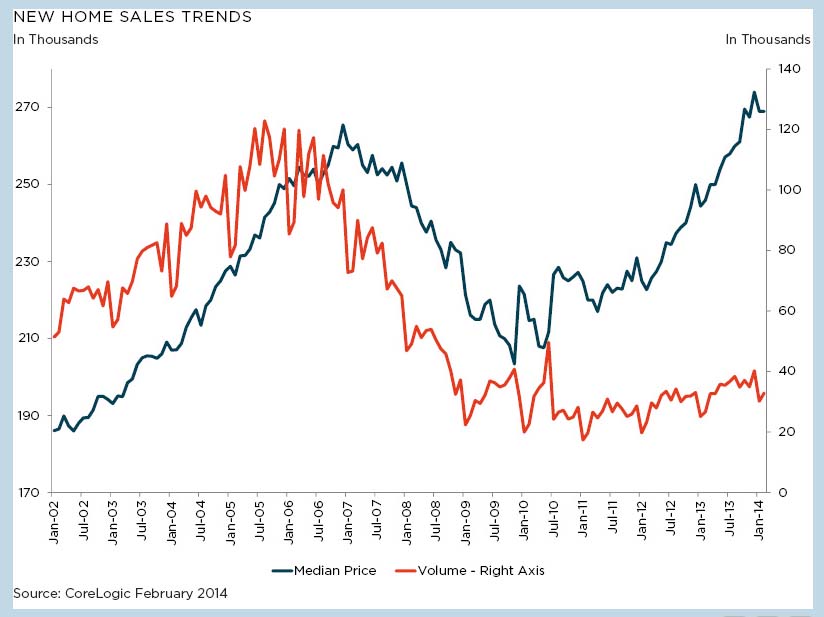
New Home Sales Trends
In this graphic we see new home sales showing volume and median price from January 2002 to the first quarter of this year. What is interesting in this New Home Sales Trends report is that current median prices are actually higher than their peak during the euphoria of 2005/06. What keeps this from becoming an alarming statistic is the Volume data that accompanies the graphic showing historically low monthly sales. This reviewers take is that we are in a very controlled slow growth mode on new home residential real estate sales. In addition, a good portion of new home sales are in the upper price points which also skews the median price upward. The scenario of limited new projects and pricier developments has driven market values on New Home Sales in a manner that should see some price correction or adjustment downward as more new home projects begin coming into the market.
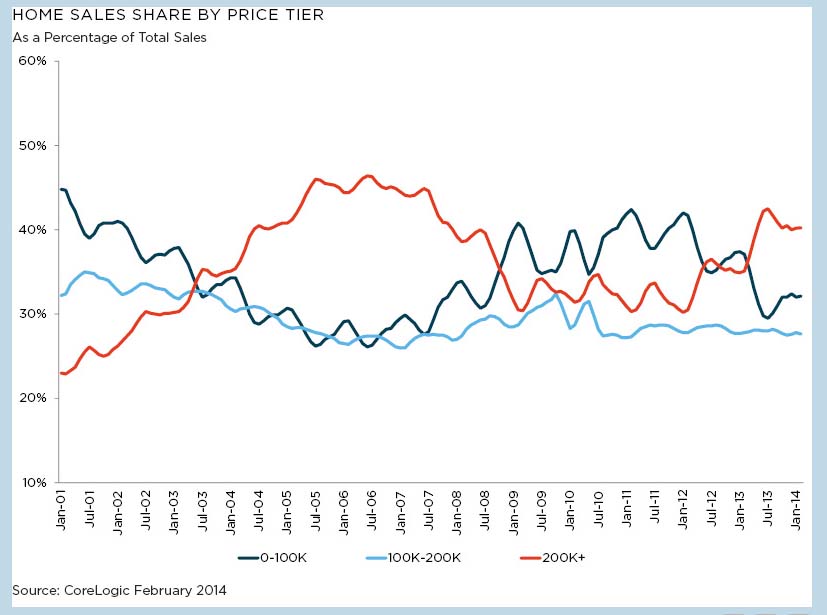
The next graphic shows the price point of sales as a percentage of total sales.
Here we see how 200k+ market (a gigantic subset, should be broken down further) was the main driving force in the last collapse and that it currently is again taking the lions share of sales nationally. What is interesting to note is that the 0-100k sales share really took off during the recover period up till about the middle of last year. A strong possibility is the downward price pressure during the recovery period placing 200k+ properties within the 100k price tier which could lead to a mistaken push for lower income housing on a national level when in fact it was distressed and REO inventory changing hands.
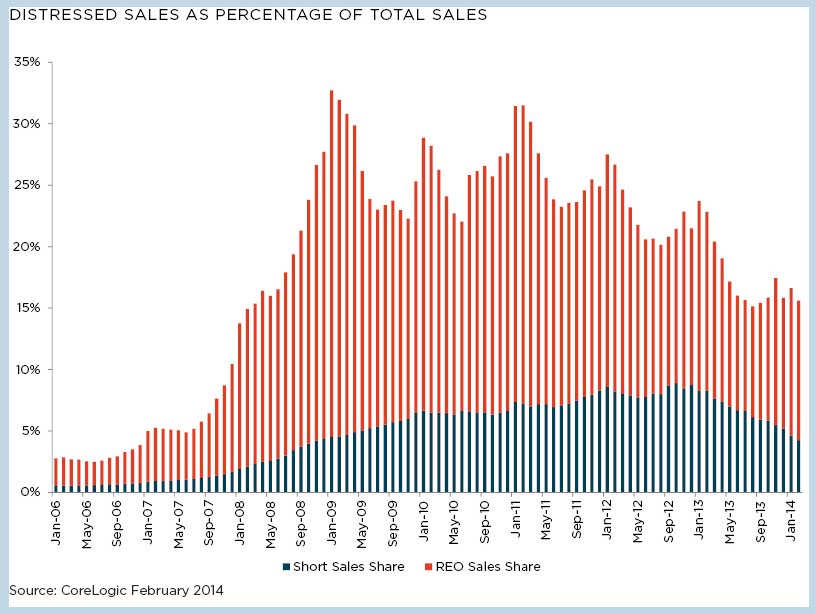
Distressed Sales as a percentage of total sales volume
Some good news from this graphic is that short sales continue to decline from their September 2012 high nationally and are retreating into the sub 3% of the market realm. REO sales continue to be a big part of the real estate sales landscape though. At current rates, it would be expected that REO properties will become less than 10% of the overall market by the begin or middle of next year putting it at twice it's historical highs from 2006.
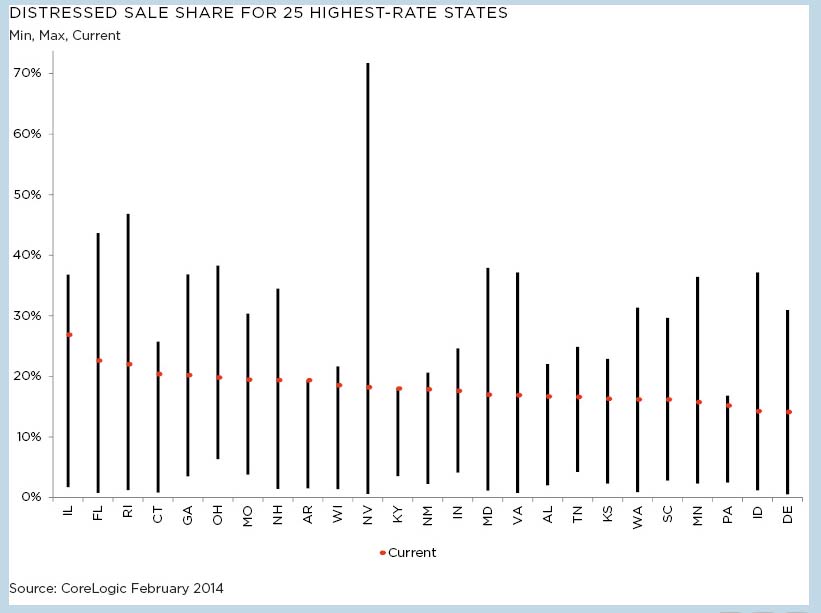
Distressed Sale Share for the 25 highest rate States
Like it or not, the state of Florida was one of the top Distressed sales markets and remains high compared to other states who also felt the brunt of the most recent economic correction. A silver lining is that little red dot you will find on the line that represents Florida's activity compared to other high incident states. Florida still ranks in the top five on a percentage basis but when taken into account our overall market growth compared to other states, this is not as painful.
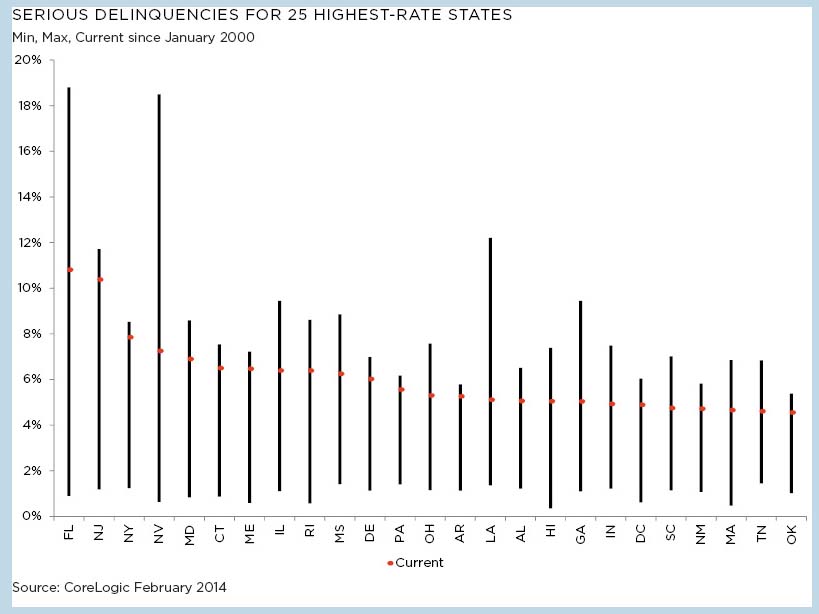
Serious Mortgage Delinquencies for the 25 highest Rate States.
Here is a telling measure of whether or not we will see more shorts sales, foreclosures, modifications, etc. The answer is yes. we are going to keep seeing these events. Florida, finally is showing some easing of it's statewide delinquency rate as it begins to near 10% which is off of it's historical high of almost 12%. With the current government programs to refinance, consolidate, and reduce principal and interest payments beginning to work, it is believed that the we should see fewer short sales come up and a continuing reduction of REO properties holdings.
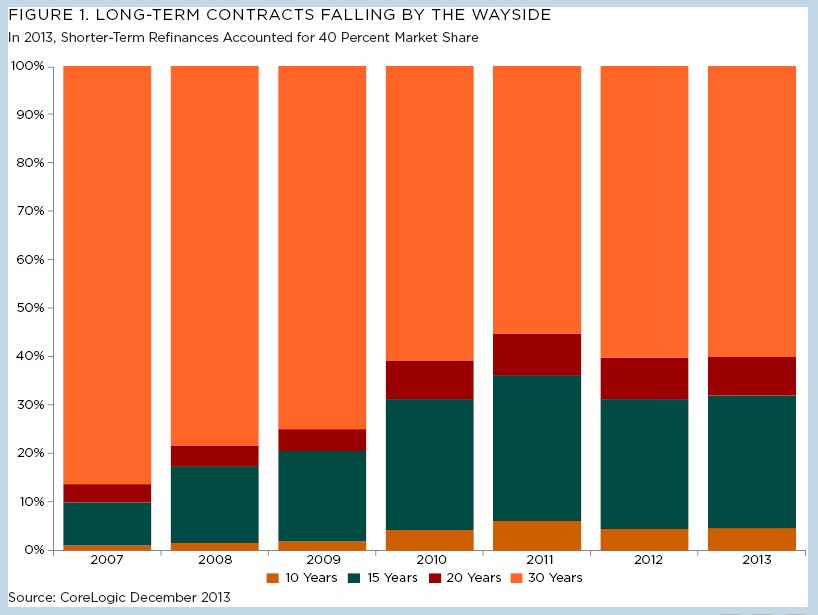
30 year mortgage instrument being replaced by shorter term refinancing
Over 40% of the mortgage refinance market is trending toward shorter term financing. This is a clear sign that Americans are becoming more aware and active participants of more aggressive payment strategies for their real estate investments. What is also on the rise but not represented in this graphic is the 40 year mortgage term. Lenders have opened up the possibility to lowering your monthly payments by amortizing your mortgage over a longer period of time much in the same manner as Europe has done for decades.
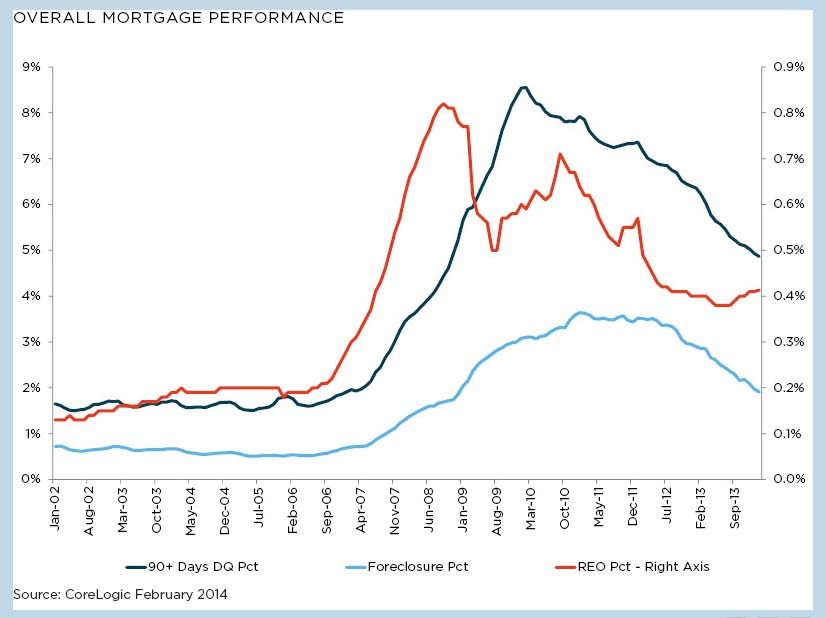
Overall Mortgage Performance compared to foreclosures and delinquent debt.
Some positive signs from the mortgage front can be seen in this graphic showing 90+ day delinquent filings dropping nationally. Foreclosures also keep moving downward on the whole. There is an uptick since February of last year in REO activity. The REO activity can be interpreted in a number of ways. The courts fast tracking old case logs. Lenders clearing out REO portfolios they have been holding on to (known by some as shadow inventory).
Overall we see marked improvement and stability both nationally but also within the South Florida real estate markets. We see this both in lender activity which is increasing both for national as well as foreign buyers. We also see buyers increasingly interested in lending options and being more risk averse than in the past.


